servy insights+
One source of truth for airport food & beverage
Enterprise analytics built on live ordering and payment data from 120+ airports. Every order and payment on Servy is reported back to the airport and its concessionaires, with no separate reporting project.
- 120+airports
- 22report views
- 3audiences
- 1set of metric definitions
Stop managing F&B from partial pictures
Sales figures arrive late. Each concessionaire reports differently. Reconciling payouts means chasing spreadsheets, and a store that stopped trading can go unnoticed for days. Insights+ fixes this at the source, because the reporting is built into the platform that takes the orders.
Built for every team that touches F&B revenue
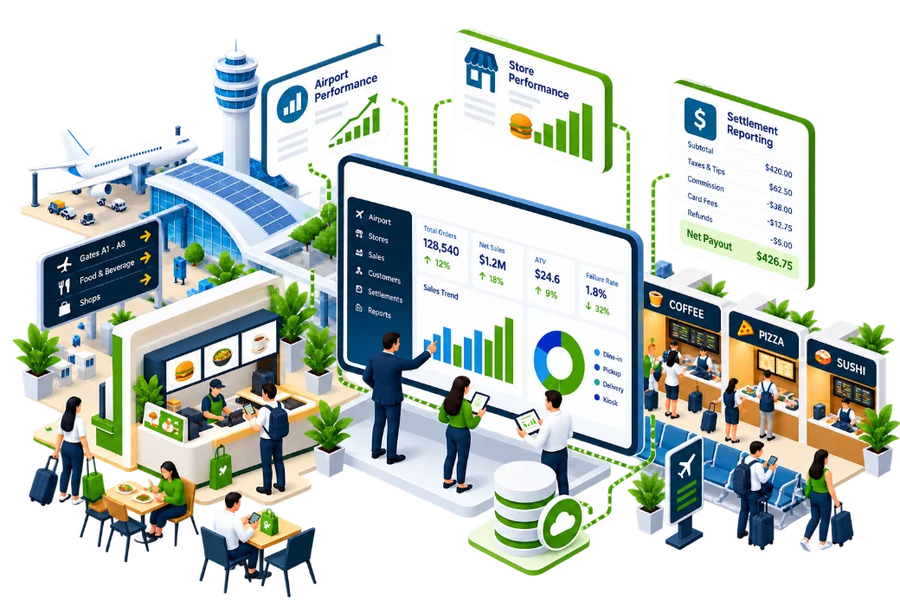
Airport Performance
The whole estate on one page: sales, promotions and campaigns.
Store Performance
Each store against similar stores: menu, baskets, customers and peer rank.
Settlement Reporting
Every payout reconciled, line by line, down to the transaction.
Same metric definitions from one store to the whole estate. Each user sees only the airports and stores they are responsible for.
airport performance
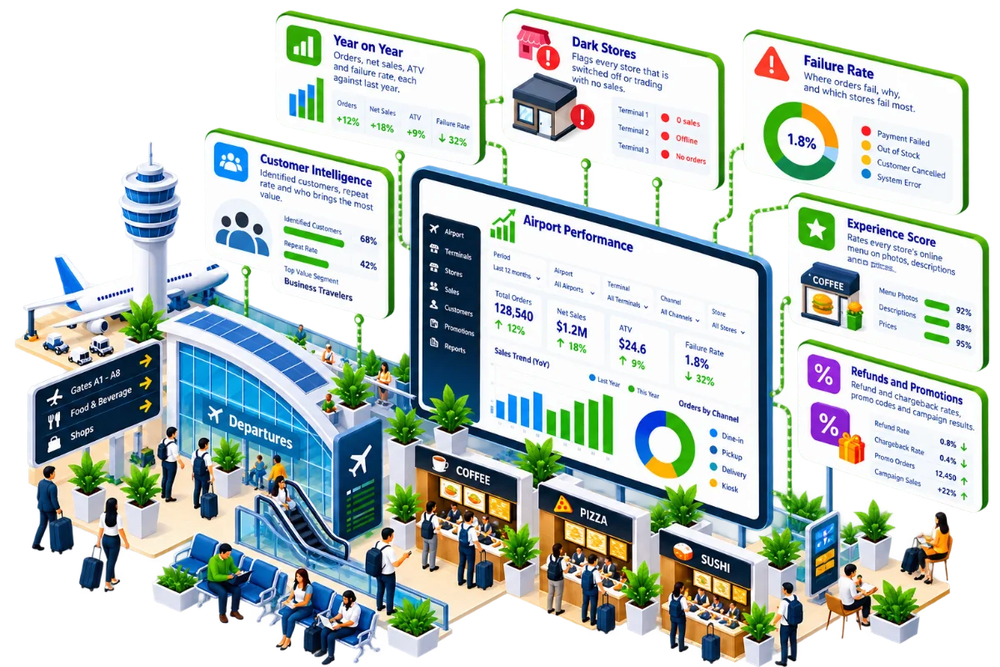
See the whole terminal at a glance
Every view filters by period, airport, terminal, channel and store.
Year on year
Orders, net sales, ATV and failure rate, each against last year.
Dark stores
Flags every store that is switched off or trading with no sales.
Failure rate
Where orders fail, why, and which stores fail most.
Experience score
Rates every store’s online menu on photos, descriptions and prices.
Customer intelligence
Identified customers, repeat rate and who brings the most value.
Refunds and promotions
Refund and chargeback rates, promo codes and campaign results.
store performance
Give every concessionaire the insight of a global chain
Concessionaires see only their own stores. The airport sees all of them.

Sales and orders
Sales, orders, ATV and failure rate against the previous period.
Menu engineering
Ranks every item by price and popularity and flags items that aren’t selling.
Basket and price
Items per basket, basket value bands and a price ladder for the menu.
Combos and pairings
Items that sell together, and orders missing a main or a side.
Conversion
Visit to cart to payment, with the biggest drop-off flagged.
Peer ranking
Each store ranked against similar stores in its terminal.

settlement reporting
Every payout explained, down to the transaction
Each country reports in its own currency, so finance teams can check payouts and answer merchant questions from one place.
-
Subtotal to payment
Subtotal, taxes and tips, every deduction, then the net payment due.
-
Every deduction listed
Card fees, commission, refunds, chargebacks and adjustments, line by line.
-
By partner and channel
Each payout split by partner, channel and number of orders.
-
Store and day detail
Orders, sales, tips and deductions for every store, every day.
-
Order-level review
Each refund, chargeback and adjustment traced to its order and payout date.
Better decisions, sooner

For airport teams
Spot lost revenue, failing stores and weak menus before they cost you a month of sales.

For concessionaires
Make menu and pricing decisions on evidence, and see how you compare with your peers.

For finance teams
Close the loop on every payout without the spreadsheet chase.
Frequently asked questions
Do we need a separate reporting project?
No. Insights+ is built into the Servy Platform, so every order and payment is reported automatically.
Can concessionaires see each other’s data?
No. Each user sees only the airports and stores they are responsible for. Concessionaires see their own stores; the airport sees all of them.
What is a dark store?
A store that is switched off or trading with no sales. Insights+ flags these automatically.
Does settlement reporting support multiple countries?
Yes. Each country reports in its own currency.
See your F&B estate clearly
Book a walkthrough of Servy Insights+ and see the reports your teams would use every day.